When a security researcher first approaches a device that needs analysis, one of the first questions is: Which services does this device expose to the outside world? Network services are the primary way a device can be reached remotely, and therefore the main entry points an attacker can use to interact with it.
In the OT world, devices can support a wide range of protocols that are common in industrial environments and designed with OT constraints in mind. These constraints include real-time operation and strict availability requirements, which pose challenges that differ from those in traditional IT systems. Alongside proprietary, vendor-specific protocols (very common in OT), there are also widely used standards such as Modbus, BACnet, and the protocols in the PROFINET family.
Because of this heterogeneity, it is useful to automate the testing of network services as much as possible, ideally without requiring deep, protocol-specific knowledge for each target. That is exactly the topic of this blog post, where we describe how we discovered four memory-corruption vulnerabilities in the PROFINET DCP implementation running on a Siemens SCALANCE LPE9403 industrial PC using unicornafl (a bridge to use the AFL++ fuzzer with the Unicorn CPU emulator). By combining process snapshots with emulation, we can fuzz complex protocol handlers efficiently without requiring the full device or a complete system environment. Specifically, we will show:
- How to create a snapshot of a Linux userspace process using a small GDB plugin (if you are only interested in the plugin, you can find it at the end of this post)
- How to load that snapshot into Unicorn
- How to identify and stub the relevant OS interactions
- How to write a Unicorn harness for afl++
All the vulnerabilities described in this document have been fixed by Siemens in the latest firmware version of the SCALANCE LPE9403 device. You can find the advisory here.
We would like to thank Siemens for their support during the disclosure process and for addressing all issues in a timely manner.
Research Scope
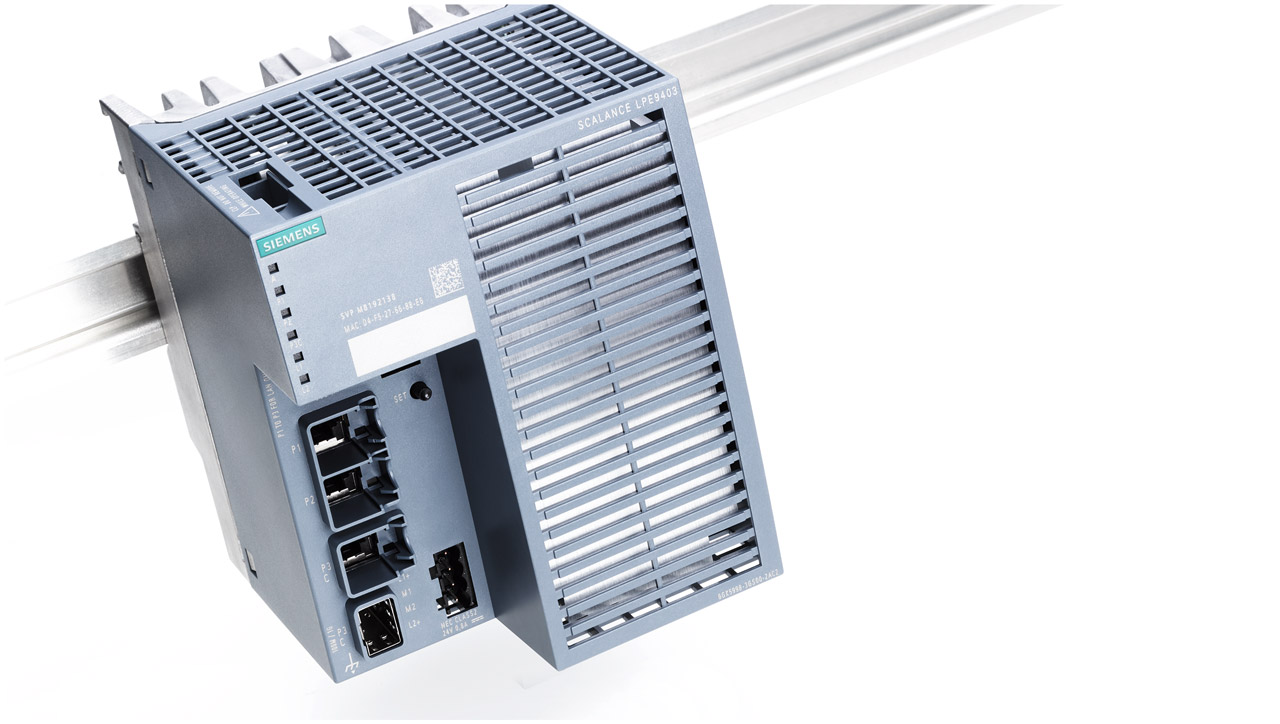
The device targeted in this research is the Siemens SCALANCE LPE9403, an industrial "Local Processing Engine" (LPE). It is a rugged industrial PC running a Debian-based Linux operating system, designed to be deployed close to the physical process, for example, in machine cabinets, on production lines, or in field control panels. In typical deployments, the LPE acts as an edge device: it collects and pre-processes data from PLCs and field devices, runs monitoring or security applications, and serves as a gateway between the OT network and higher-level systems such as SCADA, MES, or cloud-based services.
In a representative factory automation scenario, a device like the SCALANCE LPE9403 may aggregate PROFINET traffic from multiple controllers and IO devices, perform local analysis or anomaly detection, and forward selected information to central monitoring systems. Its position in the network and its role as a data and control hub make the security of its exposed services particularly relevant.
During our research, we identified multiple vulnerabilities in different network services exposed by the device. For this blog, we focus exclusively on the vulnerabilities discovered in its implementation of the PROFINET DCP (Discovery and basic Configuration Protocol) service. The remaining issues, affecting other services, will be discussed in a separate blog post. Stay tuned!
Since DCP is the focus here, let's briefly recap what it is. PROFINET DCP is a Layer 2 service used for initial discovery and basic configuration of devices on a PROFINET network. It enables IO-Controllers or engineering tools to locate and identify IO-Devices, and to read or assign fundamental parameters such as the device (station) name and IP configuration. Because DCP operates directly on the local subnet and does not depend on higher-level services such as DHCP, it is widely used during commissioning and maintenance activities. Typical operations include locating devices, assigning or modifying device names and IP addresses, triggering identification functions (for example, LED signaling to confirm physical location), and restoring devices to factory defaults.
DCP Daemon Vulnerability List and Affected Versions
The following table list all the vulnerabilities Nozomi Networks Labs has found on the DCP daemon of the Siemens SCALANCE LPE9403 version up to V4.0 HF0 during this vulnerability research:
DCP Daemon Vulnerabilities Impact
The four memory corruption vulnerabilities we identified in the DCP service allow a remote, unauthenticated attacker on an adjacent network (the same Layer 2 segment) to crash the daemon by sending specially crafted Ethernet packets.
Because the DCP service is used for device discovery and retrieving device information, an attacker could, in some deployment scenarios, effectively blind SCADA systems by making the device appear unreachable.
Furthermore, if DCP is used during initial network deployment, an attacker could crash the service and prevent the device from obtaining an IP address.
Fuzzing the Siemens DCP Implementation
On the Siemens SCALANCE LPE9403, DCP can be used to configure the device's network settings (for example, the IP address) without the need for a DHCP server.
The device permits the DCP server to run in write mode only during commissioning; once the Admin password is changed, write access is disabled. However, the server remains active and can still be used to discover the device and read its network configuration.
At the implementation level, the SCALANCE LPE uses AArch64 Linux, and the DCP service is a native user-space daemon (dcpd.bin) bound to all three interfaces of the device (P1, P2, and P3C) that listens for Layer-2 DCP traffic:
From a security standpoint, this service is an attractive target because it is:
- reachable on every device interface,
- running as root, and
- unauthenticated.
Thus, it is a juicy target to fuzz.
There are multiple ways to fuzz the service. For example, we can isolate the parsing routines and test them using LD_PRELOAD and use QEMU to instrument it.
Since the service is quite small, we decided to use snapshot fuzzing. At very high level, the idea is to:
- Reverse engineer the executable to identify key functions, such as the one that parses the input coming from the network
- Take a snapshot of the (userspace) memory and registers of the process just before it receives the input
- Load the memory in Unicorn engine (i.e., a CPU emulator based on QEMU)
- Write a harness that:
- Injects the user input in memory at the correct location
- Executes the code in a meaningful way
- Use unicornafl to instrument the program
- Fuzz it using AFLplusplus
We chose stock Unicorn instead of other alternatives (such as the excellent Qiling framework) to keep things simple. The executable is relatively small, and we didn't want to introduce extra complexity or noise into the setup.
Snapshot Fuzzing

First, let's briefly introduce snapshot fuzzing in general, its main advantages, and the challenges it brings.
The core idea of snapshot fuzzing is to drive a program, or even a whole OS, to an interesting execution point, take a snapshot of its CPU/register/memory state, and then repeatedly restore that snapshot while mutating inputs directly in memory or through emulated I/O.
This technique is especially useful when reaching the part of a process you want to fuzz is time-consuming or non-deterministic. By capturing a snapshot at the right moment, you can avoid all the steps required to get to that state. From that point on, you fuzz from a deterministic, repeatable view of the target at a specific moment in time.
Of course, snapshot fuzzing also introduces several challenges.
First, because the snapshot is taken at a fixed point in execution, you cannot influence anything that happened before it. Choosing the right snapshot point is therefore critical, and often not trivial.
Second, a snapshot gives you only a static view of the system state. What happens if the process or OS needs input from the outside world? In our case, we wanted to snapshot only user space, meaning we do not capture kernel state. What if the process performs a system call? We need to intercept ("stub") those moments and model their behavior in a meaningful way.
For example, if the process tries to open a file via a system call, the stub must provide realistic responses and data to keep execution consistent.
It is also worth stressing that even if we captured a snapshot of the kernel as well, a similar issue would still arise whenever the process depends on something outside the snapshot. What if it expects keyboard input, checks a hardware sensor, or reads from a network interface? There will always be external interactions that the snapshot cannot include, and those must be modeled somehow for fuzzing to remain effective.
Part of the challenge is finding the right spot and taking the snapshot there. Ideally, you want to fuzz code that interacts with the external world as little as possible and performs only in-memory operations.
Generating the Snapshot using GDB
Now, let's go back to our DCP process and talk about how we generated the snapshot.
First, we needed to find the best point at which to take the snapshot. That required some reverse engineering of the executable. Since the DCP service is network-based, we wanted to take the snapshot right before the program reads data from the network and starts parsing it.
The service works as follows: it performs several configuration steps by reading various files in /etc/, loading settings, and then sets up a raw socket on each network interface.
To receive data, it uses the PACKET_RX_RING socket option to bind a memory buffer to the raw socket's receive ring:

Next, it spawns one thread per interface. Each thread calls poll on its socket descriptor to check whether data is available. When network data arrives, the thread invokes a handler function that processes the request and parses the packet. That function is this one:
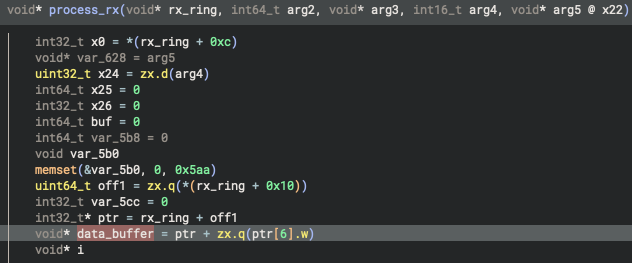
As shown in the image, the function takes the rx_ring buffer as first input. This buffer contains (as highlighted) the raw data received from the network (data_buffer).
Very early in the function, it begins parsing the packet and executing the required logic. That makes this function an ideal point at which to create the snapshot.
To do so, we used GDB along with a small plugin (included in the appendix) that saves all readable userspace memory regions to a user-defined folder, along with the values of all CPU registers:
Initialize the Unicorn State
At this point, we used the data saved through the GDB snapshot to initialize a Unicorn state. We used unicornafl so that we could later instrument the snapshot and use it in afl-fuzz.
Also, we needed a function with which we can insert the input data in memory where the process_rx function expects it.
This is a Python snippet that does the trick (some functions and classes were omitted for brevity):
As we can see, the snippet loads the .bin files and the regs.json file generated using GDB, and writes them in the Unicorn's Uc object, which represents the status of the emulated machine. Also, it provides the function inject_input, that modifies the Unicorn state with the provided input data.
Initialize the TLS
A typical pitfall when using this technique to fuzz user-space Linux programs is handling Thread Local Storage (TLS).
Many libc features rely on TLS (for example, the stack canary). If we don't model TLS correctly, the snapshot may fail to execute properly as soon as it calls a libc function.
Because the TLS is architecture-dependent, the way we handle it depends heavily on the platform the snapshot runs on.
Fortunately, on Linux AArch64 the TLS pointer is stored in the register tpidr_el0, which is easily accessible from user space and can be retrieved by our GDB plugin. In this case, setting up TLS is simply a matter of restoring tpidr_el0 to the value observed in GDB.
That said, TLS setup can require more work on other architectures. For example, on x64 the TLS pointer is held at fs:0, so you must configure the FS segment register correctly in Unicorn for the snapshot to behave as expected.
Stubbing the Relevant APIs
At this point, we configured our Unicorn state to resume execution from where we stopped it in GDB.
What was still missing is emulating the environment. As we noted earlier, what happens if the snapshot code executes a system call? We need to stub those out.
Since we didn't want to stub the entire Linux kernel, we only implemented what we needed. Our approach was iterative:
- We registered a Unicorn hook on every instruction to track calls (e.g., bx addr) and returns (e.g., pop lr). This lets us construct a shadow call stack.
- We registered another Unicorn hook that raises an exception whenever a system call occurs.
- We ran the snapshot on a test input. When an exception was raised, we inspected the shadow call stack to understand what was happening, then implemented the appropriate stub.
Here's what the code looks like:
This approach continues even after the fuzzer has started. If the fuzzer discovers a path that triggers a previously unimplemented system call, it will crash. By analyzing the crash, we can identify the missing system call and implement a stub for it.
This process can be tedious, but if the snapshot is chosen well, the number of system calls that get triggered should be manageable. Unfortunately, in our case the executable opened and parsed configuration files while processing network packets, and we had to implement quite a few stubs.
By the end of this iterative process, we had stubs for the following system calls:
- socket
- mkdirat
- write
- sendto
We also stubbed the following libc functions (often it's easier to stub a higher-level function than a system call):
- fopen
- fclose
- getline
- calloc
- free
Finally, we stubbed a couple of internal functions as well, for example, one of them controlled the device's LEDs.
This is what a stub looks like in our code (the calloc stub in this case):
As we can see from the snippet, we are using the uc.hook_add unicorn API to add the hook at the address where the calloc is in memory. The hook itself retrieves the parameters from the X0 and X1 registers, writes the result in X0 and setup PC to the return address (stored in the LR register).
The BPF Filter
Now that we initialized the Unicorn state from the snapshot, added a function to inject network input into that state, and implemented the relevant stubs so everything runs smoothly, are we done?
Unfortunately, not yet. The device registers a BPF filter on its sockets to discard malformed packets early at the kernel level.
BPF is a lightweight in-kernel virtual machine that lets user programs supply custom filtering or processing logic for packets and other kernel events. A filter is a small program written in the language understood by the BPF virtual machine, and it is executed in the kernel just before packets are passed to userspace.
We retrieved the filter using the ss tool on the device's shell:
This is where the executable registers it:
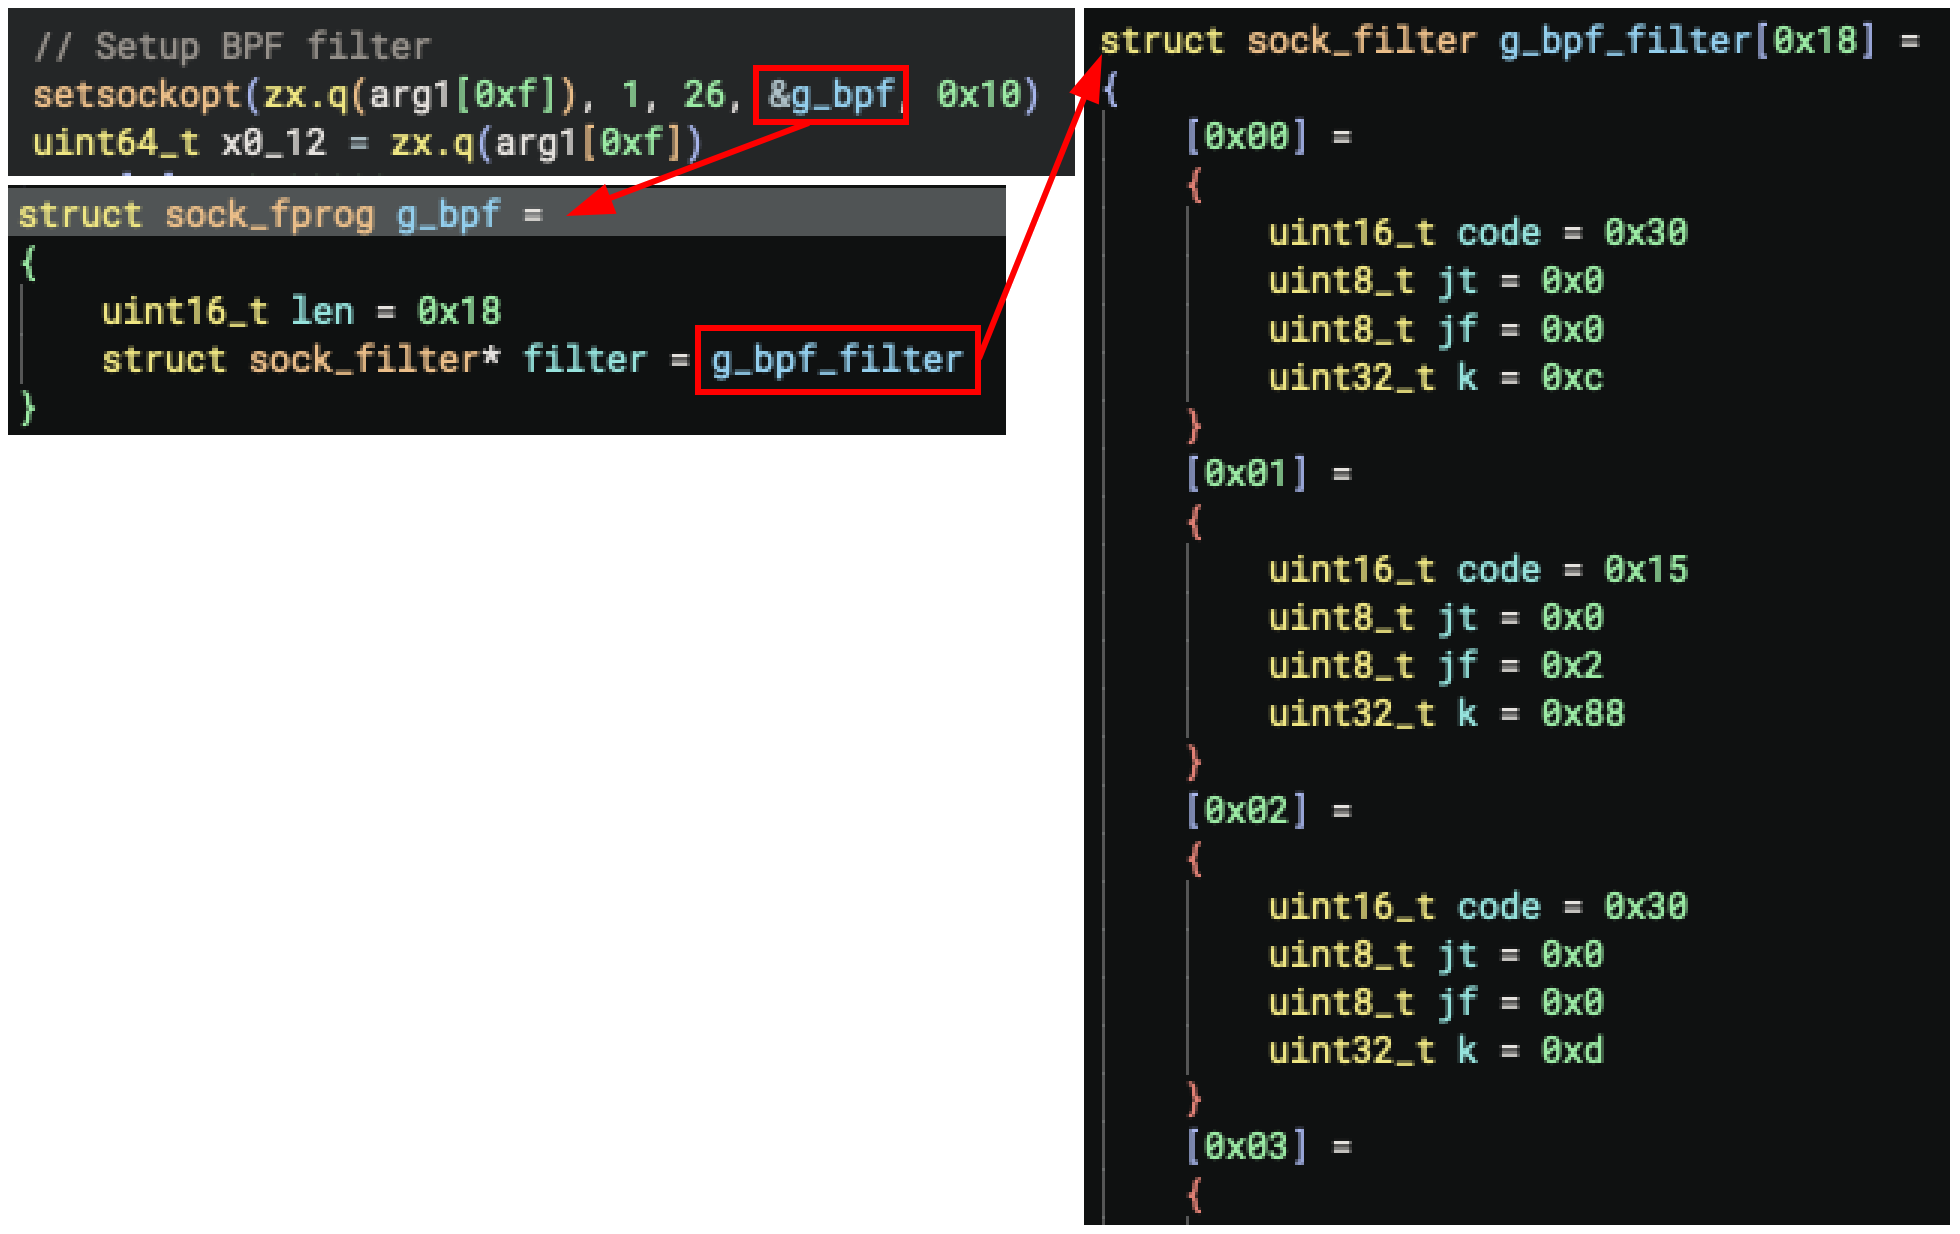
If we don't take this filter into account, our fuzzer might generate inputs that would be dropped in a real deployment. That means we could waste time exploring states that are unreachable on the device. So, let's analyze the filter more deeply.
Here is the disassembled BPF filter (we used the capstone engine):
The filter performs two groups of checks:
- It verifies that the Ethernet type is 0x8892 (PROFINET), either in the standard Ethernet case (offset 12) or in the VLAN-tagged case (offset 16).
- Then it checks whether bytes 18,19 or bytes 14,15 match one of these values: 0xFEFE, 0xFEFD, 0xFEFF, or 0xFEFC.
To make our fuzzing realistic, we must account for this filter when generating inputs. Our solution was simple: we reimplemented the same logic in Python and validated every generated input against it. If an input were rejected by the BPF filter, we would discard it.
Run AFL++
At this point, we had almost everything we needed to start the fuzzer and find some crashes. What's still missing was:
- An initial corpus
- Some glue code required by afl++
For the corpus, we captured some pcap files containing legitimate DCP interactions with the device and extracted the Ethernet payloads from them.
The glue code, instead, looks like this:
Now we truly had everything in place, and could run the fuzzer as follows:

The performance is not great, but it's good enough to start finding some crashes!
Bonus Input: Make it Flash!
The beauty of fuzzing is its ability to automatically discover new execution paths that weren't exercised by the initial test corpus.
Because we can easily detect when a new path triggers a previously unseen system call, we can use the fuzzer not only to find crashes, but also to generate inputs that reveal new behaviors in the device without fully reversing the protocol.
A simple example is an input discovered by the fuzzer that makes the device's LEDs flash.
This specific DCP packet is meant to make the device easily located in a server room, but it was not present in our initial corpus.
We were able to uncover it because the service executed a shell script after receiving the input that was used to light the LEDs.
This is the fuzzer-generated packet and the resulting device behavior:

Results and Takeaways
In this blog, we showed how a Linux executable can be fuzz-tested using snapshot fuzzing with aflunicorn. We walked through the process of generating a snapshot and stubbing the relevant OS interactions. Although setting up the snapshot can be daunting, the level of introspection it provides is valuable not only for fuzzing, but also for reverse engineering. In our fuzzing campaign, we uncovered four distinct memory corruption issues, which Siemens has since patched in the latest release of the SCALANCE LPE firmware. If you're working with closed-source binaries or embedded firmware, we encourage you to experiment with snapshot fuzzing and see what issues you can uncover in your own targets!
Remediation
Siemens has addressed these vulnerabilities through security patches for the SCALANCE LPE9403 firmware and published a security report. Asset owners and operators are strongly urged to:
- Update affected Siemens SCALANCE LPE9403 devices with the newer version of the firmware.
- Implement network segmentation to limit exposure of systems.
- Monitor network traffic for the presence of vulnerable assets.
To help organizations promptly identify whether the devices with the vulnerable firmware are present in their environment, asset owners can rely on the advanced capabilities of Nozomi Networks OT/IoT Security Platform. The platform provides deep visibility into network traffic and host activities, enabling effective vulnerability and threat detection across OT networks.
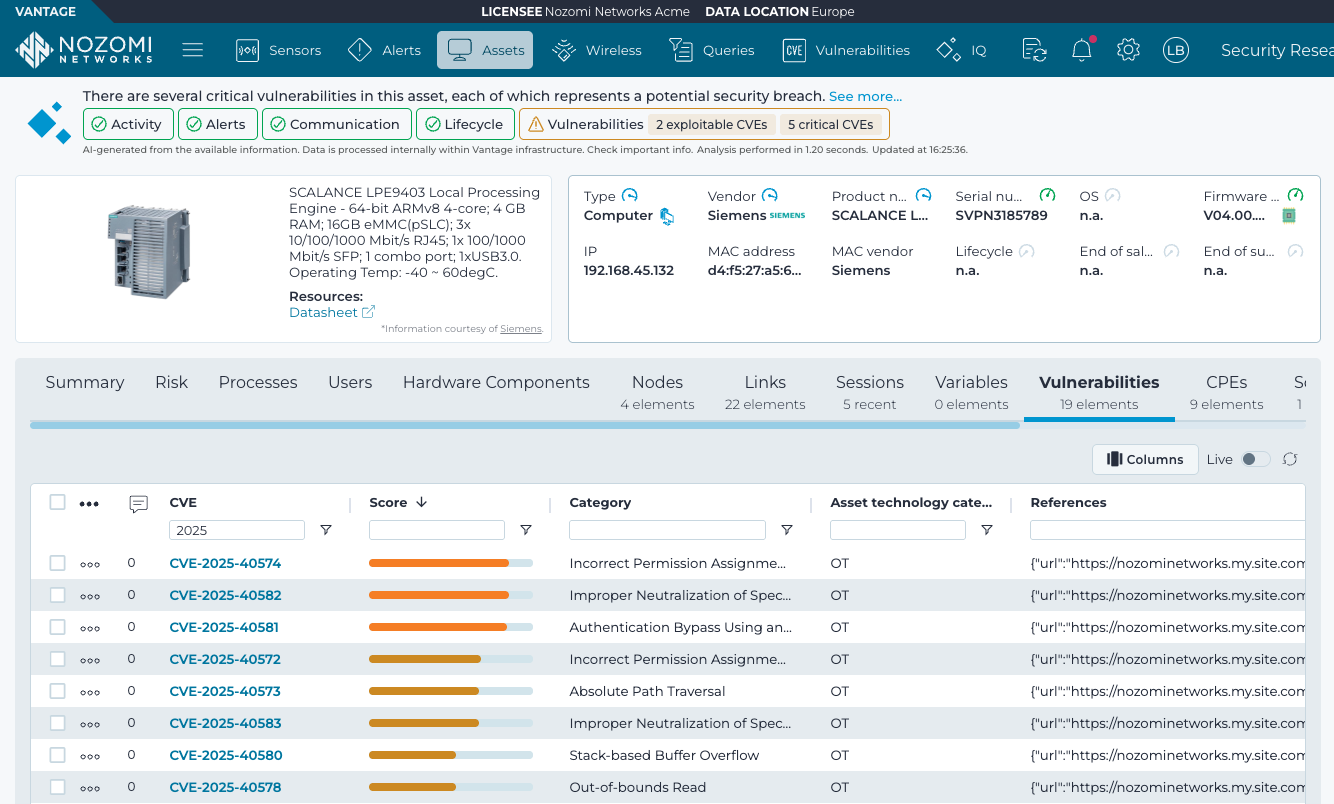
This proactive monitoring empowers security teams to respond to vulnerabilities and attacks swiftly and effectively, minimizing the impact of attacks targeting critical networks. To learn more about Nozomi Networks OT/IoT Security Platform and see it in action, request a demo today.
Taking prompt action is vital to protect critical infrastructure and maintain operational integrity.
Appendix
GDB Plugin
Small GDB plugin to snapshot the user-space memory and registers of a process.
To use it, just add source /path/to/plugin.py to your ~/.gdbinit file. Then, you can use the command gdbdumper inside GDB.





.webp)